ES
ES RU
RU DE
DE PL
PL IT
IT TR
TR FR
FR BR
BR NL
NL CN
CN CZ
CZ UA
UA HU
HU SE
SEData Visualization PowerPoint Presentation Template
![]() Sales:
Sales:
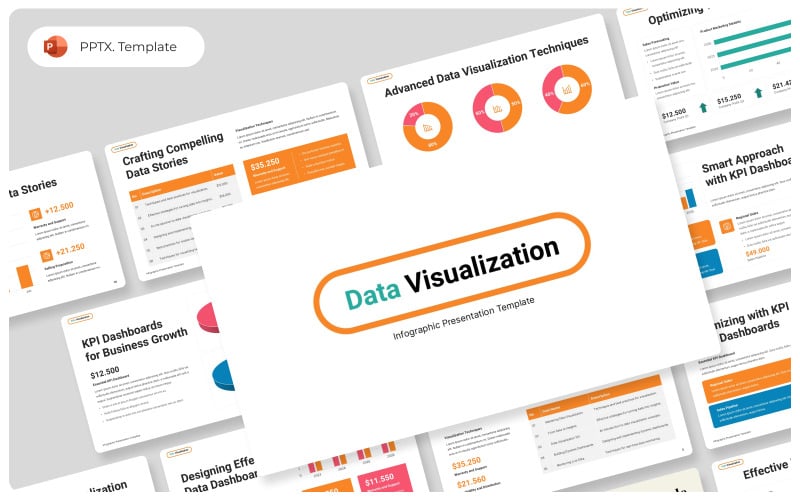
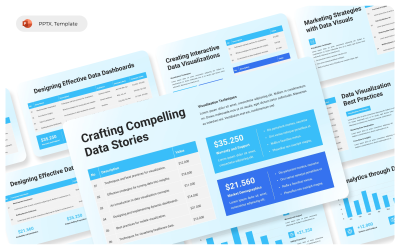
The Data Visualization PowerPoint Template enables professionals, analysts, and business leaders to present complex data in a clear and engaging format. By leveraging data visualization techniques, this presentation enhances the flow of essential metrics, trends, and analytical insights. Small businesses and private companies can use this template to improve audience engagement and ensure better data comprehension.
This data visualization presentation is structured into three key sections: data storytelling methods, dashboard design principles, and advanced visualization techniques. These elements help analysts organize and process data effectively. The template’s well-structured format ensures that information is visually compelling and easy to understand.
Designed for data analysts, business strategists, and corporate teams, this data visualization presentation enhances decision-making through clear insights. The template includes KPI dashboards and storytelling tools that allow users to present critical data in a professional and impactful manner.
Discover high-quality data visualization presentation templates to complement your slides and enhance your professional reports. A well-planned data visualization format ensures better clarity, allowing teams to base their strategies on accurate and meaningful data.
Example of included content:
Crafting Compelling Data Stories | Analytics through Data Visualization | Designing Effective Data Dashboards | Data-Driven Decisions | Advanced Data Visualization Techniques | KPI Dashboards for Business Growth | Effective KPI Dashboards for Leaders | Optimizing with KPI Data Dashboards | Smart Approach with KPI Dashboards | Data Visualization Best Practices
Features:
- 30 Total Slides
- 16:9 Full HD
- Designed for Microsoft PowerPoint
- Drag & Drop Image (Using Placeholder)
- Editable Charts
- Using Free Fonts
0 Reviews for this product
0 Comments for this product